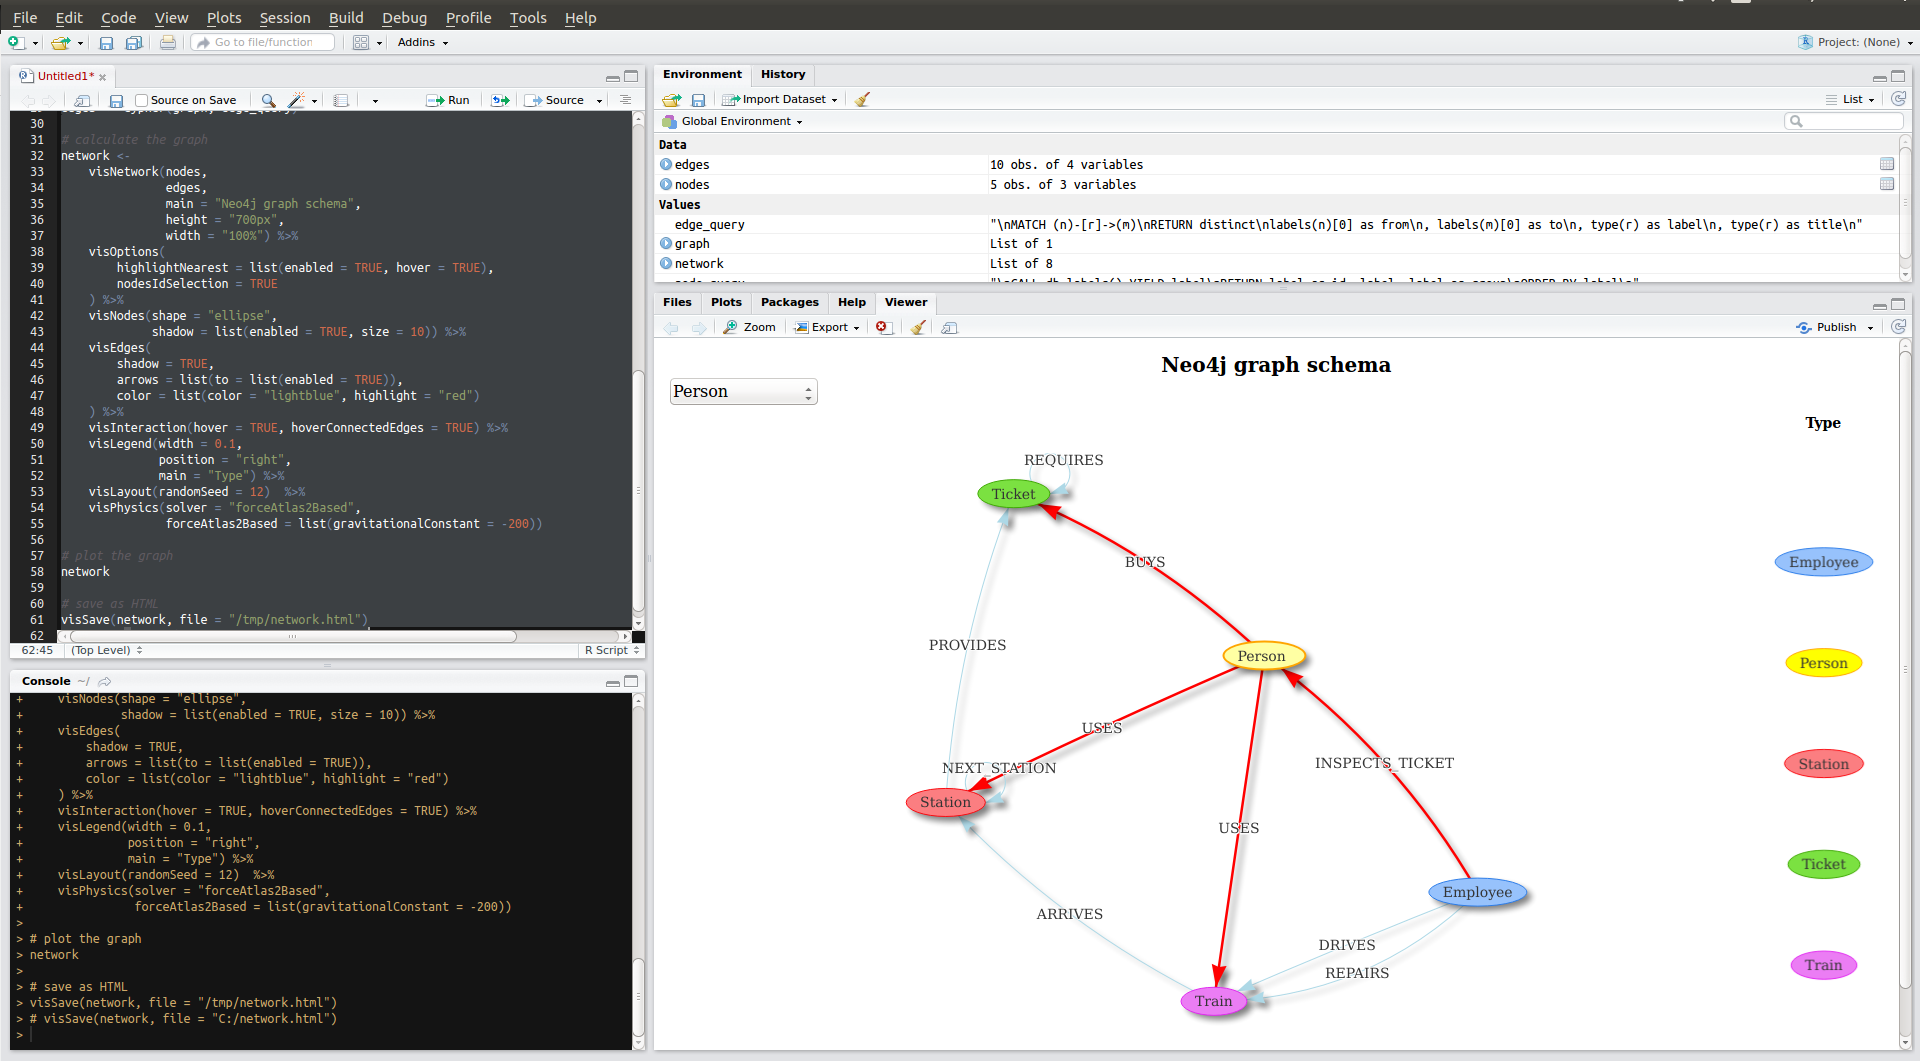
The goal of this tutorial is to generate interactive HTML snippets for a prettier API documentation. »Example API documentation - Spring Data Neo4j«
Contents
- Requirements
- Source Code
- Sample data
- Docker
- Beyond R and visNetwork
- GitHub / DockerHub / Comments
- Further reading
Preface
This tutorial uses RNeo4j a R package by Nicole White to visualize Metadata. Knowledge about the R programming language is NOT MANDATORY. I walk you through installing RStudio and executing R. You just need to know Cypher.
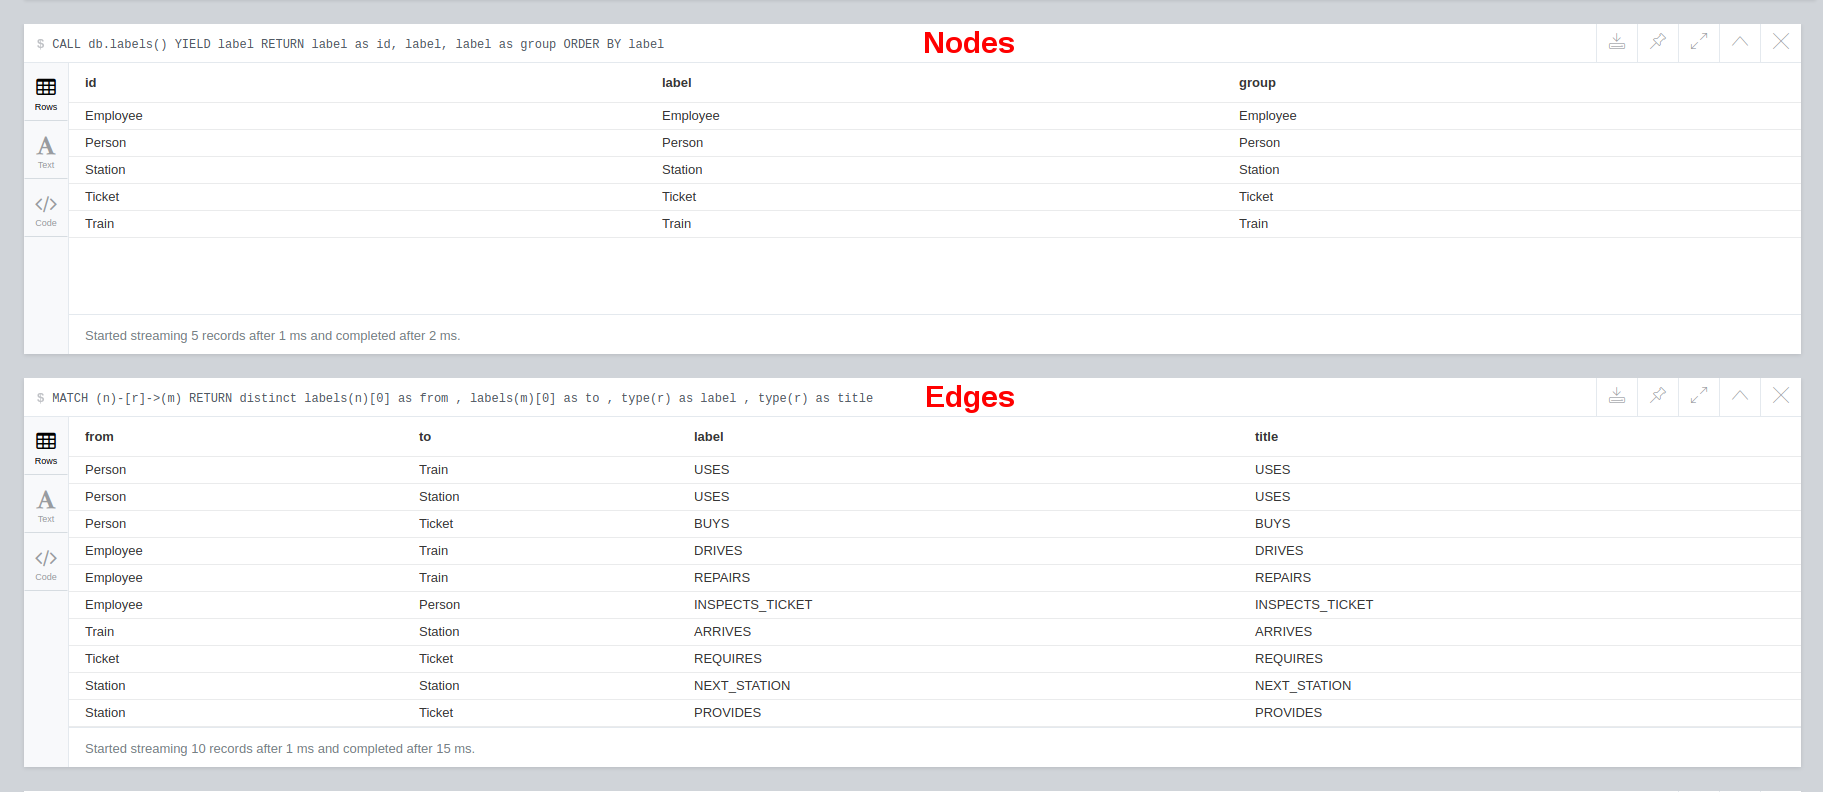
node_query <- "
CALL db.labels() YIELD label
RETURN label as id, label, label as group
ORDER BY label
"

edge_query <- "
MATCH (n)-[r]->(m)
RETURN distinct
      labels(n)[0] as from
    , labels(m)[0] as to
    , type(r) as label
    , type(r) as title
"
Requirements
- Neo4j database with some data
- RStudio to execute R
Demo database
Local
- Start a Neo4j server
- If the database is empty copy-paste this example data → Neo4j Browser
Docker
# start Neo4j database - https://hub.docker.com/_/neo4j/
docker run -ti --rm  \
            -p 7474:7474 \
            -p 7687:7687 \
            --env=NEO4J_AUTH=none \
            phoen1x/visnetwork-graph-schema
Setup RStudio
Install RStudio
Watch this video - Install RStudio
Install required Packages
Watch this video - Install Packages
install.packages("visNetwork",repos = "http://cran.r-project.org")
install.packages("RNeo4j",repos = "http://cran.r-project.org")
Source Code
R-Script
Start RStudio and open a new R-Script tab Ctrl+Shift+N. Then copy-paste the source code. View on GitHub
# http://datastorm-open.github.io/visNetwork/
library(visNetwork)

# https://github.com/nicolewhite/RNeo4j
library(RNeo4j)

# connect to database
graph <- startGraph("http://localhost:7474/db/data/")
# graph <- startGraph("http://localhost:7474/db/data/", username="neo4j", password="neo4j")

# https://nicolewhite.github.io/2015/06/18/visualize-your-graph-with-rneo4j-and-visNetwork.html
node_query <- "
CALL db.labels() YIELD label
RETURN label as id, label, label as group
ORDER BY label
"

edge_query <- "
MATCH (n)-[r]->(m)
RETURN distinct
      labels(n)[0] as from
    , labels(m)[0] as to
    , type(r) as label
    , type(r) as title
"

# get neo4j data
nodes <- cypher(graph, node_query)
edges <- cypher(graph, edge_query)

# calculate the graph
network <-
    visNetwork(nodes,
               edges,
               main = "Neo4j graph schema",
               height = "700px",
               width = "100%") %>%
    visOptions(
        highlightNearest = list(enabled = TRUE, hover = TRUE),
        nodesIdSelection = TRUE
    ) %>%
    visNodes(shape = "ellipse",
             shadow = list(enabled = TRUE, size = 10)) %>%
    visEdges(
        shadow = TRUE,
        arrows = list(to = list(enabled = TRUE)),
        color = list(color = "lightblue", highlight = "red")
    ) %>%
    visInteraction(hover = TRUE, hoverConnectedEdges = TRUE) %>%
    visLegend(width = 0.1,
              position = "right",
              main = "Type") %>%
    visLayout(randomSeed = 12)  %>%
    visPhysics(solver = "forceAtlas2Based",
               forceAtlas2Based = list(gravitationalConstant = -200))

# plot the graph
network

# save as HTML
visSave(network, file = "/tmp/network.html")
# visSave(network, file = "C:/network.html")
Mark all lines Ctrl+A and run the R-Script Ctrl+Enter
Result
Troubleshoot
You can watch more of MarinStatsLectures if you need help executing R-Scripts.
Troubleshoot Windows
# change value
visSave(network, file = "C:/network.html")
Troubleshoot URL and authentication
# change values
graph <- startGraph("http://localhost:7474/db/data/", username="neo4j", password="neo4j")
How it works
Tweak result
You probably want to customize the node_query / edge_query and explore your own schema with the Neo4j procedures
# "native" neo4j schema call
CALL db.schema()

# get all node types
CALL db.labels()

# get all edge types
CALL db.relationshipTypes()
Or add restrict the nodes to view only a part of the graph.
node_query <- "
CALL db.labels() YIELD label
WHERE label IN ['Person','Station','Train']
..."

edge_query <- "
MATCH (n)-[r]->(m)
WHERE labels(n)[0] IN ['Person','Station','Train']
..."
Or tweak the graph layout with the visNetwork documentation
# repulsion of nodes -> length of edges
forceAtlas2Based = list(gravitationalConstant = -50)
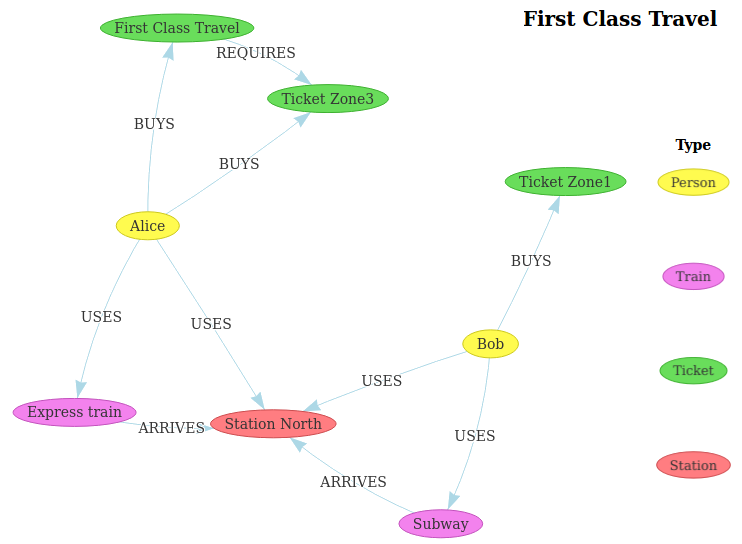
Sample data
# http://datastorm-open.github.io/visNetwork/
library(visNetwork)

# https://github.com/nicolewhite/RNeo4j
library(RNeo4j)

# connect to database
graph <- startGraph("http://localhost:7474/db/data/")
# graph <- startGraph("http://localhost:7474/db/data/", username="neo4j", password="neo4j")

# https://nicolewhite.github.io/2015/06/18/visualize-your-graph-with-rneo4j-and-visNetwork.html
node_query <- "
MATCH (n)
WHERE n.name in ['Alice','Bob','Express train','Subway','Ticket Zone1','Ticket Zone3','First Class Travel','Station North']
RETURN  n.name as id
      , n.name as label
      , labels(n)[0] as group
"

edge_query <- "
MATCH (n:Person)-[r]->(m)
WHERE n.name IN ['Alice','Bob']
RETURN
      n.name as from
    , m.name as to
    , type(r) as label
    , type(r) as title
UNION
MATCH (n:Ticket{name:'First Class Travel'})-[r]->(m:Ticket{name:'Ticket Zone3'})
RETURN
      n.name as from
    , m.name as to
    , type(r) as label
    , type(r) as title
UNION
MATCH (n:Train)-[r]->(m:Station{name:'Station North'})
RETURN
      n.name as from
    , m.name as to
    , type(r) as label
    , type(r) as title
"

# get neo4j data
nodes <- cypher(graph, node_query)
edges <- cypher(graph, edge_query)

# calculate the graph
network <-
    visNetwork(nodes,
               edges,
               main = "Sample: First Class Travel",
               height = "700px",
               width = "100%") %>%
    visOptions(
        highlightNearest = list(enabled = TRUE, hover = TRUE),
        nodesIdSelection = TRUE
    ) %>%
    visNodes(shape = "ellipse",
             shadow = list(enabled = TRUE, size = 10)) %>%
    visEdges(
        shadow = TRUE,
        arrows = list(to = list(enabled = TRUE)),
        color = list(color = "lightblue", highlight = "red")
    ) %>%
    visInteraction(hover = TRUE, hoverConnectedEdges = TRUE) %>%
    visLegend(width = 0.1,
              position = "right",
              main = "Type") %>%
    visGroups(groupname = "Person", color = "#FFFB4F") %>%
    visGroups(groupname = "Station", color = "#FF7D81") %>%
    visGroups(groupname = "Ticket", color = "#69DD5B") %>%
    visGroups(groupname = "Train", color = "#F382ED") %>%
    visLayout(randomSeed = 12)  %>%
    visPhysics(solver = "forceAtlas2Based",
               forceAtlas2Based = list(gravitationalConstant = -80))

# plot the graph
network

# save as HTML
visSave(network, file = "/tmp/network.html")
# visSave(network, file = "C:/network.html")
Docker
Make sure you have a working Docker, docker-compose and Git environment.
# download project
git clone https://github.com/phoen1x/visnetwork-graph-schema.git

# start container
cd visnetwork-graph-schema/docker
docker-compose up -d

# WAIT A FEW SECONDS for Neo4j to boot then run R-Scripts
docker-compose exec neo4j Rscript /scripts/Docker.R &> /dev/null

# view results in web browser
firefox ../scripts/output/Docker.html

# stop container
docker-compose down
Beyond R and visNetwork
vis.js the Javascript library behind visNetwork
Define what you want to plot in DOT language
var DOTstring = 'mynetwork {';
DOTstring +=    '    Person->Station;'
DOTstring +=    '    Person->Train [label=USES];'
DOTstring +=    '    Station->Train [label=ARRIVES];'
DOTstring +=    '}'
And use this HTML Template to import DOT language into vis.js
<!doctype html>
<html>
<head>
    <title>Your Neo4j database state --- Sat Apr 01 12:34:56 CEST 2017</title>
    <!-- http://visjs.org/#download_install -->
    <script type="text/javascript" src="https://cdnjs.cloudflare.com/ajax/libs/vis/4.21.0/vis.min.js"></script>
    <link href="https://cdnjs.cloudflare.com/ajax/libs/vis/4.21.0/vis.min.css" rel="stylesheet" type="text/css" />
    <style type="text/css">
        #mynetwork {
            width: 600px;
            height: 400px;
            border: 1px solid lightgray;
        }
    </style>
</head>
<body>
    <p>Your Neo4j database state --- Sat Apr 01 12:34:56 CEST 2017</p>
    <div id="mynetwork"></div><div id="config"></div>
    <script type="text/javascript">
        // provide data in the DOT language
        var DOTstring = 'mynetwork {';
        DOTstring +=    '    Employee -> Person [label=INSPECTS_TICKET];';
        DOTstring +=    '    Employee -> Train [label=DRIVES];';
        DOTstring +=    '    Employee -> Train [label=REPAIRS];';
        DOTstring +=    '    Person -> Station [label=USES];';
        DOTstring +=    '    Person -> Ticket [label=BUYS];';
        DOTstring +=    '    Person -> Train [label=USES];';
        DOTstring +=    '    Station -> Ticket [label=PROVIDES];';
        DOTstring +=    '    Ticket -> Ticket [label=REQUIRES];';
        DOTstring +=    '    Train -> Station [label=ARRIVES];';
        DOTstring +=    '}'

        var parsedData = vis.network.convertDot(DOTstring);
        //parsedData.nodes[0].color='yellow';

        for (var i = 0; i < parsedData.nodes.length; i++) {
            parsedData.nodes[i].group = parsedData.nodes[i].label;
        }

        parsedData.options = {
            nodes: {
                shape: 'ellipse',
                borderWidth: 2,
                shadow: true
            },
            edges: {
                width: 2,
                shadow: true,
                smooth: {
                  forceDirection: "none"
                }
            },
            "physics": {
              "forceAtlas2Based": {
                "springLength": 100
              },
              "minVelocity": 0.75,
              "solver": "forceAtlas2Based"
            },
            configure: {
              filter:function (option, path) {
                if (path.indexOf('physics') !== -1) {
                  return true;
                }
                if (path.indexOf('smooth') !== -1 || option === 'smooth') {
                  return true;
                }
                return false;
              },
              container: document.getElementById('config')
            }
        };

        // create a network
        var network = new vis.Network(
            document.getElementById('mynetwork'), {
                nodes: parsedData.nodes,
                edges: parsedData.edges
            },
            parsedData.options);
    </script>
</body>
</html>
See the vis.js documentation for more information.
Spring Data Neo4j
Graph schema
Spring Data Neo4j provides the @Relationship annotation
public class Person {
    @Relationship(type = "BUYS",
            direction = Relationship.OUTGOING)
    private List<Ticket> tickets;
}
which can be analyzed via Java Reflection and translated to DOT.
Build documentation
# download project
git clone https://github.com/phoen1x/visnetwork-graph-schema.git

# build jar / documentation
cd visnetwork-graph-schema/java/visnetwork-graph-schema
./mvnw clean package

# open result in web browser
firefox target/docs/index.html
Show database state
./mvnw surefire:test -Dtest=DotNotationPrinterTest

# open result HTML
firefox target/snippetGraphOverview.html
Important source code
- Analyse @Relationship annotations → RepositoryUtil.java
- Print DOT language → DotNotationPrinter.java
- @NodeEntities that constain @Relationship → Person.java
- Asciidoc Template → index.adoc
- HTML template for vis.js → template.html
Be aware that the GitHub example is only a quick and dirty prototype to see if it is feasible to automatically generate snippets. For proper implementation see:
GitHub / DockerHub / Comments
Please improve this tutorial and leave your comments in the GitHub issue section. Also check the DockerHub repository if you want to know more about the demo container.


